Phase Transitions and Coexistence in Nanoclusters of KCl |
|
Phase Coexistence |
|
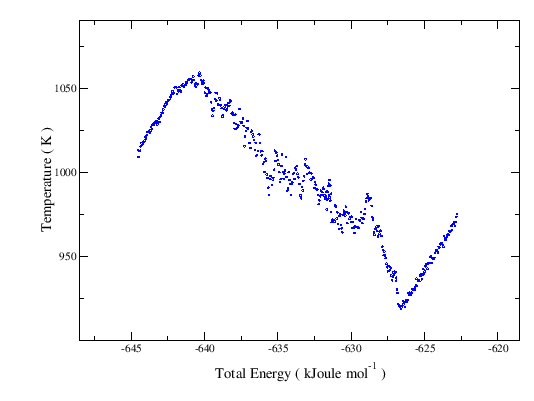
Phase Coexistence These simulations were conducted by the control of the total energy (see the Introduction on the procedure meaning and expected phase diagrams profiles). The diagram below displays the temperature as a function of the total energy for a cluster with ~5000 ions. As expected, from the onset of the solid melting (at the top of ascending line of the solid, on the left) the temperature decreases along the solid-liquid coexistence line (the descending one) until the melting ends. From there on, only liquid exists and the temperature rises again (the ascending line of the liquid, on the right). Along the solid line the cluster maintains the cubic structure (see film). To access the animations of the coexistence and liquid states, click on the points (where the mouse turns active) over the respective lines. |
